Meet My Ancestor
It's the Story of a Lifetime…
It's the Story of a Lifetime…
Knightstone Island in 1806 Plan of Weston-super-Mare showing Knightstone Island in 1806. From The First Guide to Weston-super-Mare 1822, edited by...
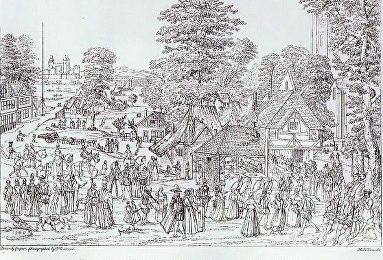
Horsleydown is an area of Bermondsey that centres around the foot of the south approach to Tower Bridge and dates...
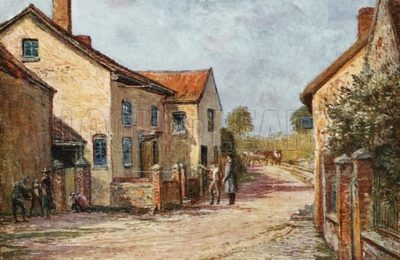
Please Note: This post is currently a work-in-progress and is just a draft post. XJF448264 Coleridge's Cottage, Nether Stowey (engraving)...
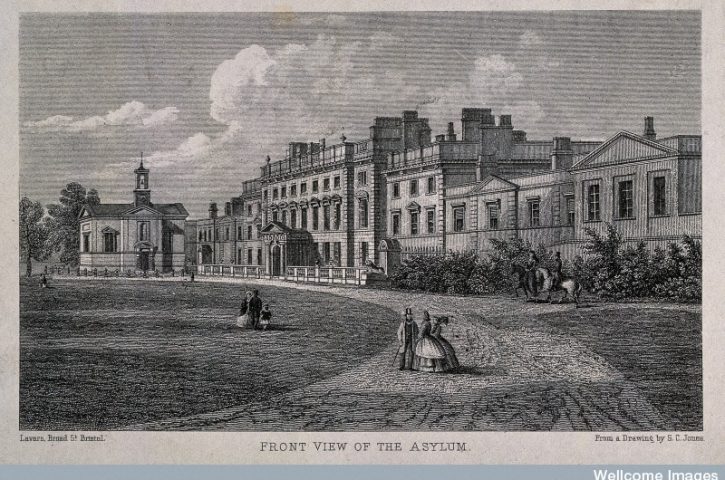
L0012305 Engraving: Brislington house Credit: Wellcome Library, London. Wellcome Images images@wellcome.ac.uk http://wellcomeimages.org Facade and gardens of Brislington house. Engraving History...
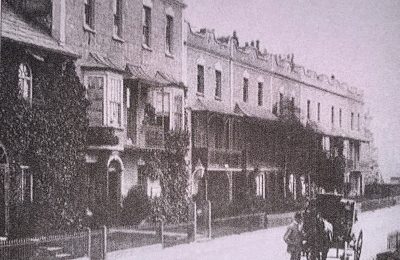
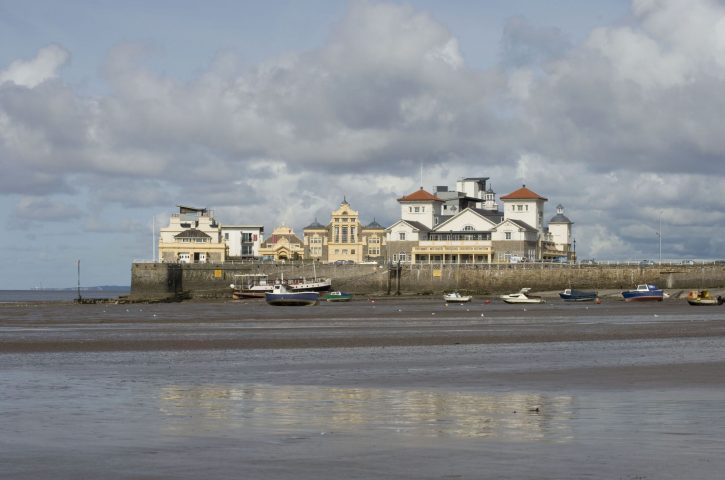
My interest in the history of The Bath Hotel (later known as The Imperial and now OLEA) in Weston-super-Mare first...
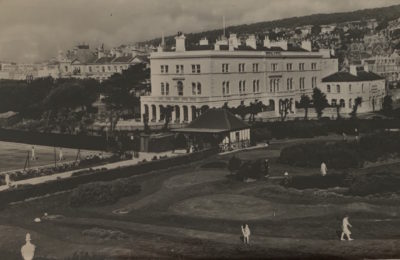
Weston-super-Mare has been a popular seaside health and leisure resort for around two hundred years. It was founded because of...